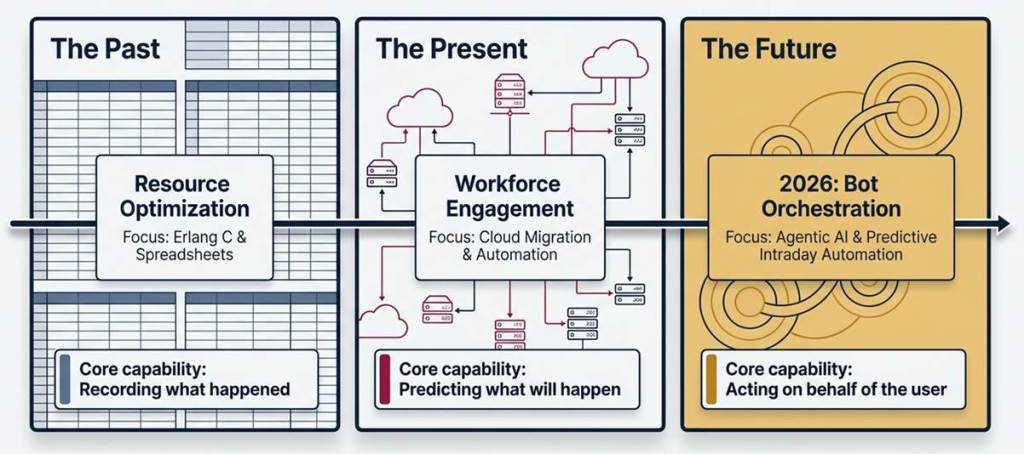
The year 2026 is one where the contact center market sees a dramatic disruption of the long-standing Workforce Management (WFM) paradigm, which has historically been grounded in a rigid and mathematical interpretation of Erlang C and Excel-driven scheduling. Today, the industry is dominated by a new wave: Agentic AI, Predictive Intraday Automation and a move from “Resource Optimization” to “Workforce Engagement Management” (WEM).
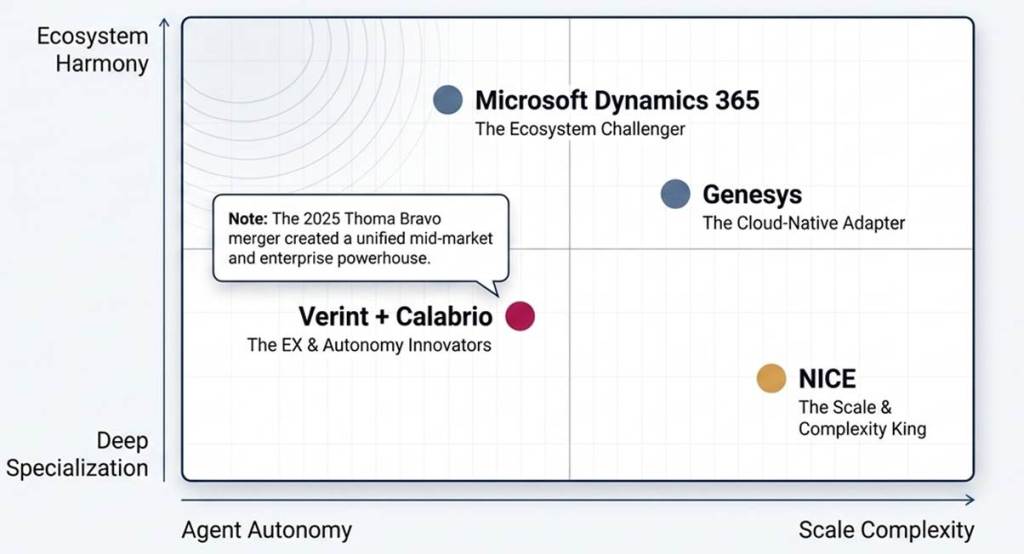
As organizations shed the skin of legacy on-prem WFM, a new hierarchy of world leaders has emerged: titans such as NICE, the newly merged Verint-Calabrio behemoth and Genesys have been dominant for years. But the emergence of Microsoft Dynamics 365 Workforce Management (WFM) and its 2026 Wave 1 ‘Agentic’ updates present a new disruption for enterprises already integrated within the Microsoft ecosystem.
1. The 2026 World Leaders: An Overview
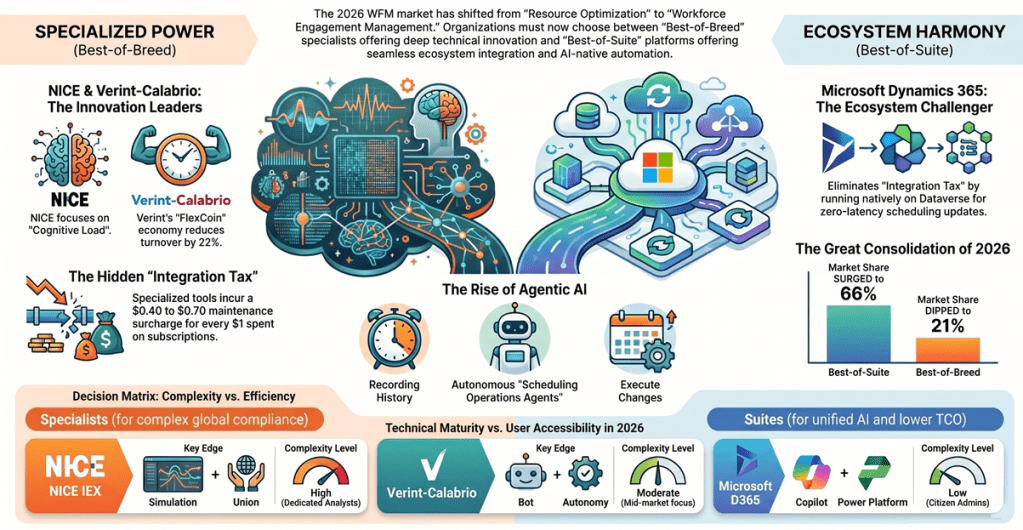
The WFM marketplace today is bifurcated into “Best-of-Breed” specialist solutions and “CCaaS-Integrated” platforms.
- NICE (CXone & IEX)
NICE remains the market share leader within the enterprise market for WFM solutions. IEX WFM is the current “gold standard” for complex, multi-site contact center environments. In 2026, NICE has placed heavy emphasis on its Cognitive Load Optimization feature; this doesn’t only consider agent availability, but the “mental toll” that an agent may have sustained during a previous customer interaction based on the interaction’s complexity.
- Verint + Calabrio (The 2025 Merger)
The acquisition of Calabrio by Verint in 2025 and orchestrated by private equity firm Thoma Bravo, has formed a “Two-Pronged” titan within the WFM space. Verint WFM supports high-end enterprise needs and is known for its deep, hierarchical permission structure. Calabrio ONE, conversely, has maintained its footing as a nimble, AI-first solution specifically geared towards the mid-market. The merged roadmap for 2026 features TimeFlex Bot, an industry-first mechanism that allows agents to trade shifts on a voluntary basis via a “FlexCoin” economy.
- Genesys Cloud CX
The entire base of Genesys’ CCaaS platform is now fully migrated to the cloud, where their WFM capabilities are also managed. The WFM offering at Genesys is underpinned by the “Automatic Best Method” forecasting engine. This feature employs machine learning to simultaneously test a myriad of forecasting algorithms against historical data in an effort to find the optimal predictive model. Genesys also leads the market in 2026 with its “Conversational Administration”; supervisor may adjust workforce management through a natural language Copilot.
2. Microsoft Dynamics 365 WFM: The New Contender
Microsoft’s move into the WFM space started out as a “native” addition to their Dynamics 365 Customer Service solution. Now, by May 2026, it has grown to become a robust, standalone application within the broader Dynamics 365 Contact Center Suite. Unlike legacy WFM players who “layered AI on top” of existing databases, Microsoft has built their WFM around an autonomous “Scheduling Operations Agent“. This agent actively monitors real-time traffic patterns, providing immediate and proactive suggested, or even automated adjustments to the contact center schedule.
Microsoft D365 WFM Key Differentiators (2026):
- Native Copilot Integration: Microsoft D365 WFM is itself effectively a specialized GPT-based agent, integrated into either the Microsoft Teams client or the Dynamics 365 dashboard, thereby placing these insights within easy view of supervisors.
- Power Platform Extensibility: Organizations are given the capability to develop and customize WFM actions through the creation of Power Automate flows. As an example, if an organization’s CSAT metrics dip below 3.0, an automated coaching break for the associated team members can be triggered through such a flow.
- Unified Data Schema: Given that WFM, CRM, and CCaaS components all share Microsoft Dataverse, information passes with zero latency. A customer interaction is completed, and the agent’s time reporting will update to reflect the agent’s true vs. Scheduled activity time, in real-time.
3. Feature-by-Feature Comparison: 2026 Edition
| Feature Category | NICE IEX / CXone | Verint / Calabrio | Genesys Cloud | Microsoft Dynamics 365 WFM |
| Forecasting Engine | 45+ AI algorithms; “Best Pick” logic. | Predictive Actions with “Why” explanation. | ML-based “Automatic Best Method.” | AI-driven “Scheduling Operations Agent.” |
| Agent Empowerment | Mobile app with deep shift-bidding. | TimeFlex Bot & FlexCoin economy. | Gamified performance dashboards. | Teams-native self-service & Copilot prompts. |
| Intraday Mgmt | Cognitive load balancing. | Predictive intraday coaching. | Real-time “Anomaly Detection.” | Autonomous schedule re-optimization. |
| Integration | Strong but often requires API work. | Open platform; “Bot-first” strategy. | Deeply native to Genesys CCaaS. | Native to Dataverse/M365. |
| Complexity Level | High (Requires dedicated analysts). | Moderate (Balanced for mid-market). | Low-Moderate (User-friendly). | Low (Designed for “Citizen Admins”). |
4. Going Deep: Forecasting & AI Maturity
The “Black Box” vs. “Explainable AI”
One of the biggest battles to be fought in 2026 is Explainable AI (XAI).
- NICE is still the king of the “Black Box”; its algorithms are tremendously accurate, but extremely hard for a human planner to reverse-engineer.
- Microsoft and Calabrio have leaned into Predictive Actions, and in Microsoft’s case, its Scheduling Agent offers a “Reasoning Sidebar” that explains why it made a change (“Suggested change due to 14% spike in ‘Return Policy’ queries in the UK region”).
Microsoft’s Edge: The Dataverse Advantage
The greatest detriment to a NICE or Verint solution is the “Integration Tax”. Systems pull from the ACD or CRM using APIs, which results in data silos. Microsoft Dynamics 365 WFM works within the Dataverse and because it sees the data real-time, it is able to provide forecasts that take into account business events, such as a marketing email blast or a product recall, before they even hit the contact center queues.
5. Scheduling & the “Gig-ification” of the contact centre
The agents in 2026 continue to have very flexible schedules. All of the global leaders are incorporating a “Gig-style” scheduling approach to their tools.
Verint’s FlexCoins
The TimeFlex Bot for Verint is a standout feature here. Agents receive “FlexCoins” for picking up unwanted shifts or spikes in volume. They are then able to “spend” the coins to take off a Friday afternoon, without the need for manager approval. For Verint-powered centers, this has translated into an average reduction of 22% agent churn.
Microsoft’s Teams-Native Approach
Microsoft takes an invisible WFM approach. Its agents are managing their schedules through Microsoft Teams rather than a separate login and portal.
Agents manage shift swapping via a Copilot chat.
Instead of supervisors finding time in the day for training, the Scheduling Operations Agent finds lulls and notifies agents that their training module on ‘New Product’ is ready with a Teams message: “Hi, volume is low. Ready for your ‘New Product’ training module?”.
6. Strategic analysis: which platform is for you?
The enterprise power user: NICE IEX
If your contact centre supports 5,000+ agents across 10 countries with complex union labor laws, then NICE remains the superior platform. Its ability to simulate and work with “Union Constraints” and “Multi-Skill Simulation” is far more advanced than what Microsoft offers at present.
The innovation seeker: Verint/Calabrio
For organizations where “Employee Experience” (EX) is key, the merger between Verint/Calabrio delivers the most innovative tools. Currently, its TimeFlex Bot is the only solution to effectively incorporate the gamification of scheduling to this extent.
The All-Microsoft Shop: Dynamics 365 WFM
For a medium-large sized enterprise that already utilizes Microsoft Dynamics 365 Sales and Microsoft Teams, the justification for a 3rd-party WFM solution begins to diminish. Microsoft has significantly closed the “Functionality Gap” in 2026 for the typical contact centre, making it suitable for 90% of use cases. The Total Cost of Ownership (TCO) is drastically reduced due to the elimination of integration costs, data storage, and more.
7. Best-of-Suite vs Best-of-Breed Analysis
The classic best-of-breed vs. Best-of-suite debate comes to a head in 2026. Where the early 2010s championed the “best-of-breed” philosophy, we are now firmly entrenched in the era of The Great Consolidation.
Best-of-Suite (The “Platform” Approach)
With this approach, you select a primary vendor, such as Microsoft, Salesforce, or Oracle, to provide a range of integrated tools from CRM to WFM to Communication to Analytics all operating under a single data schema.
The Philosophy: Seamlessness over specialization.
The 2026 Edge: Agentic AI. With all of your data in a single “Dataverse,” AI agents have the entire picture of the customer journey without complex API calls.
Best-of-Breed (The “Specialist” Approach)
Here, you select the best tool for each specific task, such as NICE for WFM, Zendesk for Support, or Slack for Communication and then build out complex integrations.
The Philosophy: Performance over integration.
The 2026 Edge: Deep innovation. Specialists generally lead the market in the release of unique, impactful features (like NICE’s Cognitive Load tracking) by an average of 12-18 months over the suite players.
The Core Comparison
| Factor | Best-of-Suite (e.g., Dynamics 365) | Best-of-Breed (e.g., NICE / Calabrio) |
| Integration | Natively Unified. Data flows instantly between modules (WFM → CRM). | The “Integration Tax.” Requires APIs, middleware, and maintenance. |
| User Experience | Consistent. One UI, one login, one training curve. | Fragmented. Different “looks and feels” for every tool. |
| Feature Depth | 80/20 Rule. Covers 80% of needs; might lack niche “edge cases.” | Deep Excellence. Highly granular controls for power users. |
| AI Strategy | Cross-Functional. Copilot sees everything across the business. | Domain-Specific. AI is incredibly smart but only within its own silo. |
| Vendor Management | “One Throat to Choke.” Simplified billing and support. | Multiple Partners. Complex licensing and potential “finger-pointing.” |
Why the change
It is not just about cutting costs-it’s about Data Velocity. “Batched” data in 2026 is too slow to keep up. When your 15-minute CRM sync with your Best-of-Breed WFM takes over your intraday AI schedule, you’ve already failed. With a suite approach, you get Zero-Latency Orchestration. > The “Integration Tax” warning. Studies suggest every $1 spent on a Best-of-Breed Subscription adds $0.40-$0.70 to integration, maintenance and data cleansing costs to keep the entire stack functioning correctly.
The “Decision Matrix”
Choose Best-of-Suite IF:
- You are heavily invested in one particular ecosystem (Microsoft Dynamics/365, etc.).
- You care most about Total Cost of Ownership (TCO) and minimizing IT overhead.
- Unified AI (Copilot) is your priority across multiple business units.
- You have a Citizen Developer mentality.
Choose Best-of-Breed IF:
- There is a specific function you must perform (i.e., Union law complexity for WFM) that requires specialized capability.
- A particular function (i.e. WFM) is a “Core Competency” rather than a support function.
- You have a massive IT / DevOps team that can manage a “Composable” stack.
- There’s a capability that has not yet been built by the major suites.
8. Summary
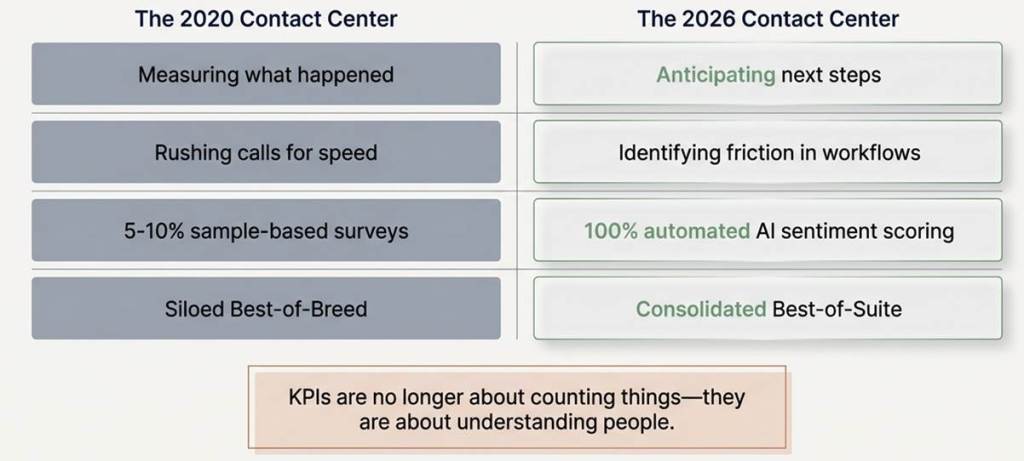
The market has evolved from recording what happened, to forecasting what will happen, and finally to executing on behalf of the user.
- NICE and Genesys are leading the pack with accuracy and scale.
- Verint is leading with agent autonomy.
- Microsoft is leading with integration and ecosystem coherence.
In 2027, we’re going to see the role of the “Workforce Manager” become the “Bot Orchestrator.” The winning platform isn’t going to be about just having the best math; it’s going to be about providing an experience agents are excited about and enabling supervisors to be on autopilot.
Key Takeaway: Stick with the existing leaders if deep technical functionality and global compliance are critical to your business; otherwise, look to Dynamics 365 WFM as a leading, fast-paced, AI-driven choice for all other operational needs within the Microsoft ecosystem.
We’re noticing a trend towards “Hybrid-Suites,” where businesses opt for a Core Suite solution and then “bolt-on” a Best-of-Breed capability for a highly specific function where they need world-class performance.
9. Appendix (Contact Centre & CCaaS KPIs)
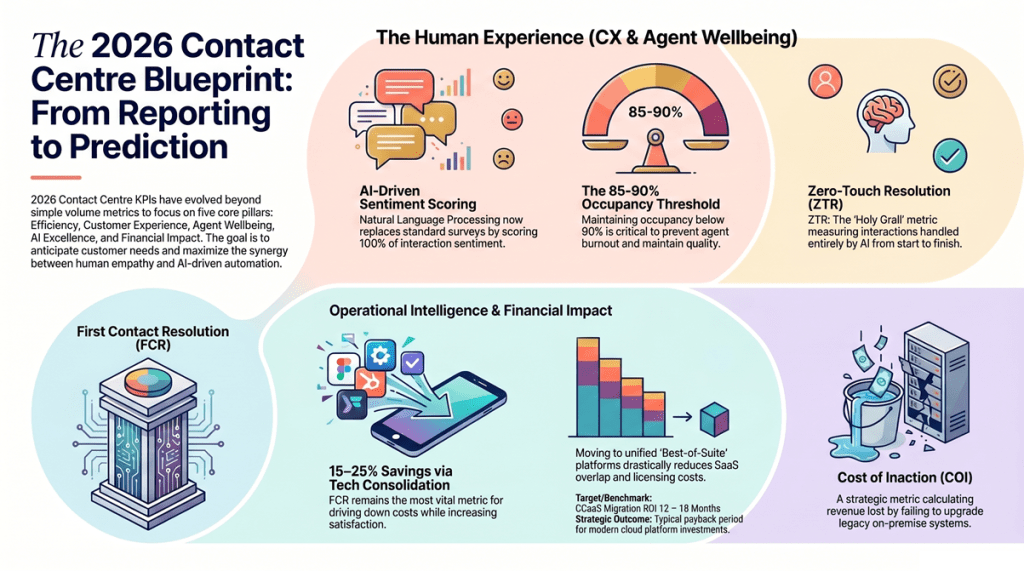
These are critical KPIs for Contact Centres and CCaaS environments in 2026, structured by five key pillars for strategic insight:
- Operational Efficiency
- Customer Experience (CX)
- Agent Experience and Workforce Management (WFM)
- AI and Self-Service Performance
- Financial Performance
In 2026, we see a shift in KPI usage from “Historical Reporting” to “Predictive Orchestration,” where the aim is not only to understand what happened, but to proactively shape future outcomes.
Pillar 1: Operational Efficiency KPIs
These are the “Engine Room” metrics that enable smooth contact center operation.
1. Average Handle Time (AHT)
This metric continues to be the standard of contact center efficiency, quantifying the complete duration of a customer interaction from start to finish, including post-call work (ACW). In 2026, the objective shifts from solely reducing the length of calls to analyzing the agent’s workflow for “friction points.” High AHT can point to either inadequate tools or lack of real-time AI assistance, while an ideal AHT signifies that agents possess the necessary information to resolve customer issues swiftly.
2. First Contact Resolution (FCR)
Arguably the most crucial operational metric, FCR measures the proportion of customer queries resolved during their initial contact. High FCR is highly desirable as it reduces operational expenses and boosts customer satisfaction. For CCaaS platforms, FCR increasingly extends to cross-channel interactions, ensuring that a customer journey initiated by a bot and then escalated to an agent is still classified as a “first contact” if resolved during that session.
3. Service Level (SL)
Service Level defines the proportion of customer interactions handled within a set time frame, typically expressed as “X% of calls answered in Y seconds.” This metric is a direct indicator of both staffing adequacy and the precision of workforce management practices. 2026 is seeing an increase in dynamic SLs, where AI-driven platforms automatically adjust targets in real-time based on fluctuations in demand and the customer’s priority, ensuring that high-value customers receive preferential handling.
4. Occupancy Rate
Occupancy Rate gauges the proportion of an agent’s scheduled work time spent actively engaging with customers (talking time, hold time, and ACW). While a high occupancy rate can seem to indicate peak efficiency, persistently high levels can contribute to agent burnout. Advanced WFM solutions like NICE IEX and Microsoft Dynamics 365 are incorporating “automated micro-break” triggers to provide agents with necessary breathing space between demanding interactions.
5. Average Speed of Answer (ASA)
ASA measures the average time a customer spends in the queue before reaching an agent. This metric significantly impacts the initial customer experience. While CCaaS platforms now offer “callback” features to alleviate wait times, ASA remains a key health indicator for the contact center. In 2026, ASA is often analysed based on customer intent to ensure that urgent inquiries are addressed more quickly than general ones.
6. Abandonment Rate
The percentage of customers who hang up before connecting with an agent or completing a self-service interaction is the Abandonment Rate. A high rate is a “red flag” for both potential lost revenue and diminished brand image. Across omnichannel CCaaS platforms, abandonment tracking is expanding to digital channels, identifying points where customers abandon a chat or messaging session due to slow responses or confusing chatbot navigation.
7. Call Volume & Channel Mix
This metric focuses on the total number of incoming interactions, and the proportion each channel takes. This is vital for 2026 workforce planning, since it helps define where customers are going, and where the center might be over-investing. If 70% of calls are happening on WhatsApp but 70% of agents are dedicated to Voice, “Mismatched Channel Mix” becomes a primary failure point.
8. After-Call Work (ACW) Time
This KPI defines the time the agent spends updating CRM notes, sending follow-up emails, or closing out after the customer has hung up. Agentic AI and ‘Auto-Summarization’ have reduced ACW times considerably in 2026 – Microsoft Dynamics 365 WFM’s Copilot, for instance, produces a real-time summary of the call allowing the agent to move onto the next interaction in seconds rather than minutes, boosting “Active Capacity”.
9. Longest Delay in Queue (LDQ)
This KPI differs from ASA by focusing on “worst-case scenario” for a customer. The LDQ is the time the single longest waiting caller waited to speak with an agent, and is critical in uncovering the “edge cases” when a specific queue (i.e. Spanish-speaking customers, high-priority technical issues) are critically understaffed and have customers slipping through the cracks.
10. Transfer Rate
Transfer rate is the proportion of interactions that an agent passes off to another agent or supervisor to get an answer. This is indicative of weak “Skills-Based Routing” or an overall problem with training. An intelligent CCaaS setup will pre-qualify customers with enough accuracy using AI that the transfer rate will drop to zero, as customers get seamlessly matched to an agent that can address their need directly.
Pillar 2: Customer Experience (CX) & Quality KPIs
Metrics that focus on the emotional and functional success of the interaction; these are “Heart” metrics.
11. Customer Satisfaction Score (CSAT)
Often acquired by a post-interaction survey asking, “How satisfied were you with the service you received today?” While it’s a standard metric, in 2026, contact centers use AI sentiment analysis on each and every call to obtain “Continuous CSAT”. This gives an organization a more accurate view of the brand’s overall health.
12. Net Promoter Score (NPS)
This metric identifies the long-term health and loyalty of an organization’s brand. Customers are asked how likely they are to recommend a brand to others on a 0-10 scale. While it’s different than CSAT in that it doesn’t look at individual transactions, it serves as an indicator of “Relationship”, and is influenced by the quality of an organization’s “Service Recovery”.
13. Customer Effort Score (CES)
This KPI measures how much effort the customer expended to get their issue resolved. In 2026, CES is a better predictor of churn than CSAT, and reflects the fact that customer defection can often be linked to “high-effort experiences” like being bounced between agents, or forced to navigate an unnecessarily complicated IVR. CCaaS now takes a holistic look at customer journey and identifies points of potential high effort, then designs them out.
14. Sentiment Score (AI-Driven)
Using natural language processing, this KPI assigns a “positive, neutral, or negative” score to the customer’s interaction, based on tone, cadence, and word choice. The contact center can utilize these scores to address “angry” callers proactively (via supervisor whispers) or even to identify agents that have effectively turned a negative interaction into a positive one.
15. Quality Assurance (QA) Score
Historically a manager listening to just 2-3 calls per agent per month, this has evolved into “Automated QA” which reviews 100% of interactions against compliance (adhering to the script and legal guidelines) and empathy standards, ensuring that all interactions maintain “Human Quality”.
16. Customer Churn Rate (Attributed to Service)
This KPI specifically targets customers who leave an organization following a negative contact center interaction. The combination of CRM data with call logs now allows organizations to see the precise “Cost of a Bad Call”, and this is being used to justify the investment in WFM and AI.
17. Resolution Time (End-to-End)
Instead of AHT, resolution time takes into account the total clock time from an issue being opened until it’s completely resolved (including any “Pending” or “Escalated” time). While complex technical support might yield a 5-min AHT and 3-day resolution, and so on. This KPI must be reduced for B2B environments (where Downtime means money out the door).
18. Interaction Consistency
One KPI to keep track of how consistent a customer’s experience is across channels. If I have an extremely “Friendly and Fast” experience on Twitter, and a “Rude and Slow” experience on the phone, then the brand has interaction inconsistency. The “Unified desktop” environments of CCaaS platforms will ensure agents have the same context and tone-of-voice rules irrespective of the customer’s channel of contact.
19. “Voice of the Customer” (VoC) Insights
VoC is not really a single number, but a categorized KPI (and essentially the ‘Top 5 Reasons for Calling’). In 2026, the same will be automatically gathered via an AI theme extraction. The moment “Difficulty Logging In” hits the #1 spot on this graph, then the contact center becomes the ‘early-warning’ to the product team that something must be done immediately (to address it).
20. Hold Time & Silence Ratio
High “Silence Ratios” (where neither agent nor customer is talking) will signal a “Slow System” or an agent who doesn’t know how to answer, forcing them to look for the correct info/answer, thus being monitored by IT and WFM for “System Latency” or training issues. The desire here would be to replace silence with “Proactive Engagement” or, in its absence, have minimal silence using integrated knowledge management.
Pillar 3: Agent Experience & Workforce Management (WFM) KPIs
The “engine” metrics focused on employee well-being and productivity:
21. Agent Attrition Rate
The percentage of the workforce leaving over a certain time period, contact centers are historically well known for high turnover (typically 30-45%) and in 2026 reducing attrition is still a top priority. High attrition leads to a “Brain Drain” and enormous recruitment costs. Here “Predictive Attrition” has emerged and WFM will identify certain agents whose performance or mood are dipping and allow for “Stay Interviews.”
22. Schedule Adherence
This tracks how accurately agents stick to their scheduled tasks. If you’re supposed to be “on phones” at 9 am but only clock in at 9:05 am your adherence drops. Once considered a “Big Brother” metric, today WFM shows agents the information about their adherence in real time for transparency purposes, showing them how their presence affects the workload on the team.
23. Employee Satisfaction (ESAT) / eNPS
This is the “internal CSAT” metric that tells the leadership if employees are happy with their jobs (based on tools, management and balance). With a “War for Talent” underway ESAT has become a board-level metric. High ESAT will correlate with high CSAT (happy employees mean happy customers) and systems like Microsoft (through Teams/Dynamics) integrate ESAT surveys on-the-fly for “pulse” checks on how agents are feeling.
24. Shrinkage
This is time agents are paid for but are not available for customers (vacation, sick leave, training, coaching and even toilet breaks). Measuring accurately is critical for “Capacity Planning” and if a manager fails to properly account for a 25% shrinkage, they will consistently be short on staff and see both their ASA and agent burnout numbers skyrocket.
25. Absenteeism Rate
While “shrinkage” implies Planned absences, absenteeism is an Unplanned absence, it’s a “canary in the mine” for the environment. In 2026, “trend analysis” of absenteeism will tell managers that when absenteeism jumps on Fridays, or after certain stressful periods, they need to address the cause rather than punish the symptom.
26. Coaching & Training Hours
This metric reflects how much time is being spent on employee development. Coaching is often the first sacrifice made when call volumes rise, yet in 2026 the investment in agent development is considered a “Critical Success Factor”. WFM systems now “protect” coaching time, ensuring that even at the busiest of times, employees get that needed 30-60 min block of time where they will be developed.
27. Internal Promotion Rate
This metric represents how many of leadership or specialized roles are filled by former front-line employees. A high internal promotion rate will serve as a powerful recruitment and retention tool in 2026 and signals a strong “Career pathing” program, convincing agents this is not a “dead end” but a career opportunity.
28. Occupancy Variance
While Average Occupancy tells you how busy an agent was, it doesn’t show how much that work is balanced across the team. If one agent has 95% occupancy and another has 60% it means one is getting “slammed” with work while the other has nothing to do due to the lack of “Skill-Based Routing.” Reducing Occupancy Variance is essential for agent equity.
29. “Speed to Competency”
This KPI indicates how quickly a new agent achieves the “Baseline Performance” (i.e. AHT, FCR) of an established agent. In 2026, “AI-driven on-the-job training” has drastically reduced this metric, with the AI suggesting “Next best action” for the agents, and “Newbies” working like “Veterans” within days, not weeks.
30. Agent Autonomy Score
This modern KPI measures how much control the agent has over their life (self-scheduling, swapping shifts, selecting channels). High agent autonomy has become the #1 factor for agent retention in 2026, measured by the usage of “self-service WFM” and agent input.
Pillar 4: AI, Automation & Self-Service KPIs
The “future” metrics that measure the effectiveness of non-human interactions:
31. Self-Service Containment Rate
This KPI shows how many customers start a journey in a self-service channel and complete it without talking to an agent. However, you need to be careful about “Containment Rate” – just because an interaction is contained doesn’t mean it’s successful, or that the customer isn’t frustrated. Therefore, the key is “Containment Rate & CSAT.”
32. Bot-to-Human Handover Rate
This metric measures how often a bot ‘fails’ and hands over the call/chat to an agent. A high rate means the bot’s “Intent Recognition” isn’t strong enough or that it hasn’t been trained on the right things. The 2026 goal is “Warm Handovers,” where 100% of context is transferred.
33. AI Intent Recognition Accuracy
This KPI measures how accurate the NLU is in identifying the customers ‘reason for calling’. If a customer has “My bill is too high”, is it categorized as a “Billing Inquiry” or a “Churn Risk”? Improving this metric is foundational to better routing and automated self-service.
34. Zero-Touch Resolution (ZTR)
ZTR is the holy grail of AI ops. It looks at how many interactions the AI completed soup-to-nuts, including actually performing backend API functions such as making the refund or changing the address. Unlike simple ‘Deflection,’ it indicates real work being done by machines and allows the human resources to focus on ‘High-Empathy’ cases.
35. Knowledge Base (KB) Effectiveness
This KPI shows how many interactions actually result from using a knowledge base article. In 2026, CCaaS platforms provide ‘Page Value’ metrics-if a user views a help article and then immediately calls into the contact center anyway, it receives a ‘Low Effectiveness Score’ and will be rewritten or reworded by the content team.
36. AI ‘Hallucination’ Rate
The holy grail in Generative AI (LLM) worlds where a critical element is measuring the occurrences of incorrectly generated or ‘made-up’ information. This metric is typically assessed with a ‘Human in the Loop’ system that provides auditing data where a QA agent flags when an AI either unauthorizedly grants a discount or provide incorrect technical instructions. The goal is to keep this at ~0% for brand and legal safety.
37. Deflection Rate (Proactive)
Proactive Deflection shows the number of interactions avoided simply by proactively contacting the customer before the problem actually occurs. For instance, detecting a shipment delay and sending a proactive automated text notification ensures the customer does not call to ask, ‘Where’s my shipment?’. This is the quintessential ‘Efficiency’ KPI-it actually reduces the work performed within the contact center.
38. IVR Abandonment by Node
This detailed KPI identifies exactly which prompt in the “Press 1 for Sales” menu that callers actually hang up. If 40% hang up at “Node 3,” it signifies that prompt is likely too confusing or too long. In 2026, ‘Visual IVRs’ and ‘Conversational IVRs’ are replacing the node system, but the ‘Path Abandonment’ metric is the equivalent.
39. Copilot Usage/Adoption Rate
For businesses utilizing the Microsoft Dynamics 365 suite or a similar integration, this measures the percentage of interactions where the agent actually utilizes an AI suggestion. If agents are not selecting the “Suggested Responses” they may be doing so because the AI’s assistance is not valuable or the agents have not been trained on how to effectively “Co-pilot” their interactions.
40. Sentiment ‘Flip’ Rate
This AI-powered metric analyses how many interactions started with ‘Negative Sentiment’ and finish with ‘Positive Sentiment’. This is a sophisticated de-escalation metric that identifies the “Empathy Heroes” of your workforce.
Pillar 5: Financial & Strategic Growth KPIs
The “Bottom Line” metrics that tell the CFO how the contact center drives value.
41. Cost Per Contact (CPC)
The total operating cost of the contact center-including all labour, technology, and facilities-divided by the total number of contacts handled. While lower is better, leaders in 2026 understand that “Cheap isn’t always Better.” An interaction handled for $2.00 that doesn’t resolve the customer issue, costs far more than a $10.00 human interaction that results in a $1,000 renewal.
42. Customer Lifetime Value (CLV) Impact
Modern CCaaS platforms can now track changes in CLV from individual contact center interactions. When customer “Spend” increases by 20% as a direct result of a high-quality interaction, the contact center has proven “Value Add” rather than a mere “Cost Center.”
43. Revenue per Successful Interaction
For centers handling sales or “Up-selling”, this KPI calculates the average dollar value received for each completed interaction. Support centers are also now evaluated on this, as AI “Next Best Actions “prompt agents to “Up-sell” customers on complementary products or services during an interaction.
44. ROI of Contact Centre Technology
This KPI is designed to quantify the financial return from investments in a WFM suite, AI bots, or moving to a cloud environment. The “Payback Period” metric calculated by ROI identifies how many months of labour savings or increased FCR it takes for the new technology to offset its upfront cost. Most modern CCaaS transformations achieve “Payback” between 12-18 months.
45. Cost of Inaction (COI)
This strategic metric, typically used by consultants, demonstrates what the organization loses by not investing in updated technology (e.g., lost revenue due to high abandonment, wasted labor due to redundant systems, compliance fines). It serves as the key “Business Case” for moving from legacy systems to modern platforms such as Microsoft Dynamics 365.
46. Agent Utilization (Financial)
Unlike ‘Occupancy,’ financial utilization measures the amount of “Revenue-Generating” or “Value-Protecting” time each agent dedicates to an interaction relative to their overall labour cost. This demonstrates the “Gross Margin” for each human agent and guides decision-making about outsourcing low-value tasks.
47. Customer Acquisition Cost (CAC) via Referrals
By tracing NPS and “Recommendation” data to the contact center, the business will be able to determine the number of new customers who were gained because they experienced a “Wow” moment during their interaction. This KPI will significantly bolster the contact centre’s reputation as a “Referral Engine.”
48. Compliance Penalty Avoidance
For “Regulated Industries,” the most crucial contact center metric could be “Zero Fines.” This metric helps the organization identify how many interactions were successfully “Audit-Proofed” using AI compliance tools, effectively avoiding large penalties that can result from mis-selling or data breaches.
49. Tech Stack Consolidation Savings
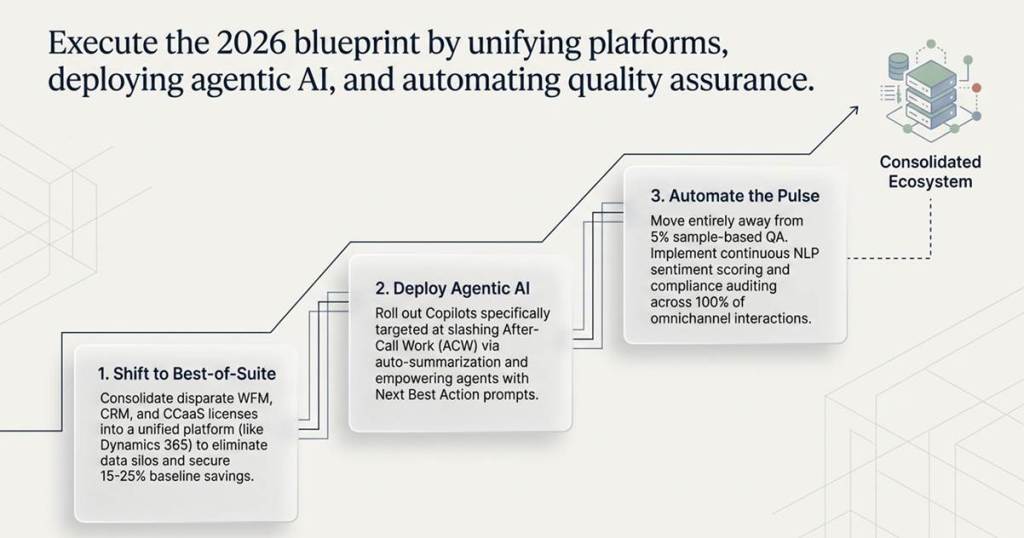
This metric quantifies how much a business saves by migrating from a “Best-of-Breed” to a “Best-of-Suite” technology approach. Typically, by migrating from 10 separate licenses to a single Microsoft or Salesforce product, a business will save 15-25% in “SaaS Overlap.”
50. Carbon Footprint per Interaction
As ESG (Environmental, Social, and Governance) goals become a corporate imperative, the “Green Cost” of each interaction is becoming a critical metric. This metric measures the total energy consumption for both data centers (cloud vs. On-prem) and the reduction in carbon emissions due to 100% of the workforce operating remotely.
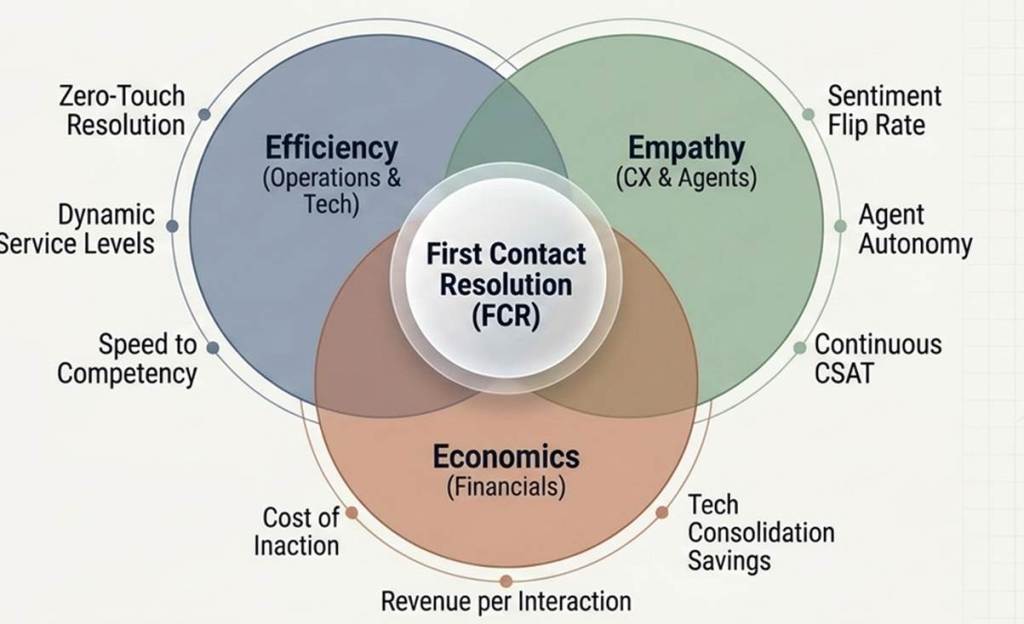
The shift from 2025 to 2026 demonstrated that KPIs are no longer simply used to count things; they are intended to measure people. Whether leveraging a standalone “Best-of-Breed” WFM tool or the integrated Microsoft Dynamics 365 suite, the goal should remain the same: achieve a “Balanced Scorecard” where Efficiency, Empathy and Economics are all equally measured.