A Comprehensive, Integrated Ecosystem: The Modern Taxi Industry Architecture Unveiled
The traditional taxi industry is at a critical juncture. Challenged by ridesharing disrupters, fluctuating demand, and complex regulatory requirements, taxi fleet operators must embrace digital transformation not merely as an upgrade, but as a survival imperative. The days of fragmented systems—where a radio dispatch tool operated in isolation from a customer database, and a finance system stood apart from daily operations—are over. To compete in the modern mobility landscape, a taxi company requires a holistic, integrated ecosystem that connects every touchpoint, from the passenger’s mobile app to the enterprise’s financial general ledger.
This article provides a comprehensive, deep-dive exploration of such an ecosystem, as presented in the accompanying 7-layer architecture diagram. This architecture, inspired by the OSI (Open Systems Interconnection) reference model, is designed for scalability, modularity, and, most importantly, seamless data integration. It showcases how a modern taxi enterprise can leverage a suite of best-in-breed technologies—including Genesys, Microsoft Dynamics 365, Oracle E Business Suite (EBS) Finance, and specialized taxi management software—to create a unified platform for enhanced efficiency, superior customer and driver experiences, and robust financial control.
The structure of this architecture is key. By segregating functions into distinct layers—from physical infrastructure to user interfaces—the enterprise can isolate complexity, integrate new components without disrupting existing ones, and gain a clear understanding of data flow. We will now proceed with a layer-by-layer analysis of this comprehensive ecosystem.
1. The OSI-Inspired Philosophy: Architecture for Scalability
The use of a layered, OSI-style structure for this architecture is not arbitrary; it is a strategic design choice. Just as the seven OSI layers abstract networking functions (physical, data link, network, transport, session, presentation, application) to allow different devices to communicate, this enterprise architecture abstracts functional systems to allow disparate software and hardware to operate as a single unit.
1.1 The Modularity of ‘Best-of-Breed’
This layered approach is crucial for a “best-of-breed” strategy. A taxi company doesn’t need to build a bespoke CRM, telephony, or ERP system; it needs to integrate the leading tools in each domain. This architecture makes that possible. For example, Dynamics 365 Customer Service provides a robust CRM capability in Layer 5, while Genesys provides leading telephony in Layer 7 and 5. Because these are in distinct, yet integrated, layers, the enterprise can replace or upgrade the CRM or the telephony solution without a complete system overhaul, as long as the integration interfaces in Layer 4 (Communication Protocols) remain consistent. This modularity reduces vendor lock-in and future-proofs the investment.
1.2 Clear Lines of Data Flow and Responsibility
The vertical structure also provides clarity on data ownership and responsibility.
- Financial Data: Flows up from the physical transactions in Layer 1 (Handheld) and 3 (Trip Analytics) into D365 in Layer 5, and then directly into Oracle E Business Suite (EBS) in Layer 2 for final closure.
- Operational Data: Telemetry (location, speed) moves from Layer 1/3 (In-taxi Telematics) up to Layer 6 (Taxi Management System Logic) and then into D365 (Layer 5) to serve as the operational data provider for the Operations and CSAT teams in Layer 7.
- Customer Interaction: Originates in Layer 7 (Web/App/Phone), flows through Layer 4/5 (D365/CTI) to connect with business logic in Layer 6 (Bidding/Fare).
This clear flow allows different teams (Operations, Finance, CSAT, IT) to know exactly where to access their required data and which system is the “source of truth.”
2. A Detailed Deep-Dive into the Seven Layers
We will now traverse the stack, starting from the outermost interaction point.
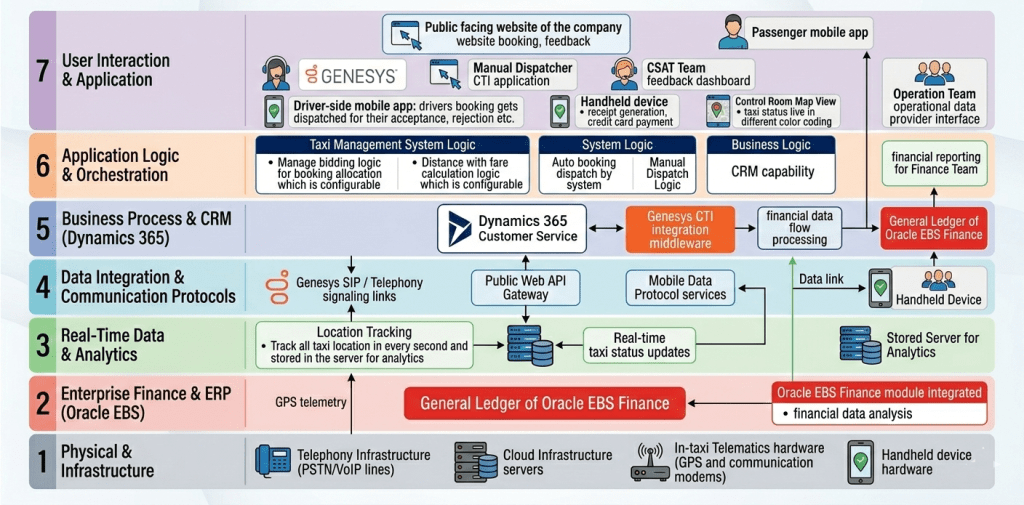
2.1 Layer 7: The Frontline Interfaces (User Interaction & Application)
This is the most visible layer, where the enterprise meets its passengers, drivers, agents, and operational staff. It is the destination and source for crucial user input.
The Passenger Experience:
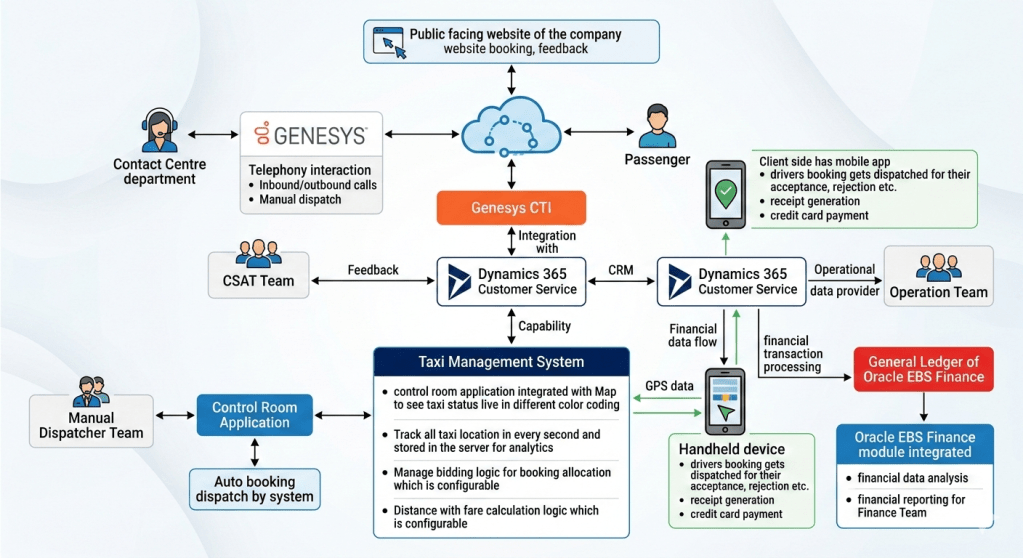
- Public Facing Website: A critical entry point for booking, feedback, and customer engagement. As required the website provides a comprehensive “website booking, feedback” interface.
- Passenger Mobile App: In a mobile-first world, this app is the passenger’s primary interaction tool, facilitating seamless booking, trip tracking, and communication.
The Driver Experience:
- Driver-side Mobile App (Client Side): This app on the driver’s device is where bookings “gets dispatched for their acceptance, rejection etc.” It is also the point where GPS data and trip telemetry are gathered.
- Handheld Device (Hardware Interface): Crucial for , this device, integrated with the mobile app, manages “receipt generation” and secure “credit card payment.” This is a critical physical-to-digital link for financial flow.
The Agent & Team Interfaces:
- Contact Centre Department (Genesys): blend of manual and automated functions. This interface allows the “Contact Centre Team is using Dynamics 365 Customer Service along with Genesys for Inbound and outbound call supported by Auto booking dispatch by system along with remaining by manual dispatcher Team” (Original text block). It includes a “Manual Dispatcher CTI application” interface. This demonstrates the fusion of human skill and automated efficiency.
- CSAT Team Feedback Dashboard: The dedicated interface for the CSAT team allows them to review and manage customer satisfaction data, acting as a feedback loop directly linked to D365 in Layer 5.
- Control Room Map View: a control room with a “live in different color coding” taxi status. This map view interface is where the “Live taxi status updates” (from Layer 3) are presented visually to the Operations Team.
- Operations Team Operational Data Provider Interface: A specific interface for the Operations team to consume the data generated by Dynamics 365, serving as their “Operational Data Provider”.
- Finance Team Financial Reporting Interface: This interface allows the Finance team to consume the integrated data and analytics from Oracle E Business Suite (EBS)
2.2 Layer 6: Business Rules and Operational Orchestration (Application Logic & Orchestration)
This layer is the engine of the enterprise, containing the logic and business rules that define the taxi service itself. It processes the operational input from Layer 7, applies constraints, and directs action.
Taxi Management System Logic:
- Manage Bidding Logic (Configurable): this component contains the critical rules for booking allocation. The bidding logic could be based on distance (closest driver), driver acceptance rating, first-responder, or a competitive bid process. Crucially, this logic is “configurable,” allowing the business to adapt rules in real-time based on market conditions, peak hours, or new business strategies.
- Distance with Fare Calculation Logic (Configurable): this is where dynamic pricing and fare calculation rules reside. The calculations are based on distance (which is accurate to Layer 3), time, wait time, tolls, and dynamic multipliers. The “configurable” nature is key, allowing the enterprise to set different pricing models for different cities, seasons, or vehicle types.
System Orchestration Logic:
- Auto booking dispatch by system & Manual Dispatch Logic: This orchestrates the flow of bookings to the dispatcher interfaces (Manual Dispatcher CTI app) in Layer 7, managing the blend of automated dispatch and manual override. It ensures that the right booking goes to the right driver or agent queue.
Business Logic (CRM Capability):
- CRM Capability: this sub-component (of the central CRM system) defines the logic behind the “Customer 360” view. It handles data deduplication, profile matching, and interaction tracking, ensuring that when Genesys pulls a customer record, the agent has all necessary context.
2.3 Layer 5: Business Process and CRM (Dynamics 365)
This layer is the operational heart of the system, acting as the central hub for operational data, customer interaction, and inter-departmental workflows. It bridges the gap between customer-facing applications (Layer 7) and core business applications (Layer 6 and 2).
- Dynamics 365 Customer Service: D365 provides the unified “CRM capability.” It serves as the “Operational Data Provider” (Original text block) for the Operation and CSAT Teams in Layer 7, delivering a consistent view of the business.
- Genesys CTI integration middleware: This middleware is the vital link that integrates Genesys CTI with D365 (Requirement for original text block). It enables “screen pops” with customer information for incoming calls, allows for outbound dialling directly from the CRM, and syncs all call activity with the customer record, supporting the “Inbound and outbound call” functionality of the Contact Centre Team
- Financial data flow processing: This component handles the orchestration of financial data flow from the physical handheld transactions to the General Ledger of Oracle E Business Suite (EBS). It acts as an integration point that may include data filtering, aggregation, and validation before pushing “financial transaction processing” (Original text block) to Oracle E Business Suite (EBS) in Layer 2.
2.4 Layer 4: Data Integration and Communication Protocols
This layer contains the pipes and channels that allow the vertical layers of the stack to communicate. Without these protocols, the data would remain siloed.
- Web API Gateway: This secure gateway manages all web-based communication, linking the Public Facing Website in Layer 7 (booking/feedback) to the core booking logic in Layer 6 and D365 in Layer 5.
- Mobile Data Protocol Services: A set of specialized protocols for the reliable transmission of mobile data from the Driver App and Handheld Device (Layer 7) back to the enterprise. This ensures that a crucial piece of data like a GPS update or a payment transaction is not lost, even in areas with poor cellular coverage.
- Data link for Handheld Device: This dedicated link in Layer 4 connects the Handheld device from Layer 7 to the financial processing logic in Layer 5.
- Genesys SIP / Telephony signalling links: this component manages the voice and signaling communication paths (SIP, VoIP) between the Contact Center agents (Layer 7) and the telephony platform (Layer 5), supporting inbound and outbound call functionality.
2.5 Layer 3: Real-Time Data and Analytics (Telemetry)
This layer deals with telemetry, state, and real-time intelligence. It ingests a high volume of raw data from the physical layer and processes it into useful information for the operational logic above.
- Location Tracking: this component “Track all taxi location in every second and stored in the server for analytics.” This is a continuous feed of accurate GPS data (from Layer 1). The high-frequency (every second) updates are essential for real-time map visualization and precise fare calculations.
- Real-time taxi status updates: Processed and validated location and status updates are fed from here up to the “Control Room Map View” in Layer 7, ensuring the map is live and accurate to the nearest second.
- Stored Server for Analytics: This server acts as the primary data lake for storing all historical GPS and telemetry data, ready for offline “analytics.” The stored data can be used for things like driver performance analysis, route optimization, and identifying fraudulent activity.
2.6 Layer 2: Enterprise Finance and ERP (Oracle E Business Suite (EBS))
This layer is the financial closure and compliance hub of the enterprise. It is a secure environment for final data processing, general ledger maintenance, and financial analysis.
- General Ledger of Oracle E Business Suite (EBS) Finance: requirements state that financial transactions are “pushed to General Ledger of Oracle E Business Suite (EBS) Finance” This is the final destination for all financial data flow, providing the central “financial reporting for Finance Team.”
- Oracle E Business Suite(EBS) Finance module integrated: This integrated module provides the powerful “financial data analysis” capability allowing the Finance team to generate detailed reports and gain insights into the enterprise’s financial health, driver commission structures, and asset performance.
2.7 Layer 1: Physical and Infrastructure (Hardware)
This foundational layer is where the ecosystem meets the physical world. It includes all the hardware assets required for the system to function.
- In-taxi Telematics hardware (GPS & communication modems): This hardware in the vehicle is the physical source of all telemetry data generating GPS telemetry that is fed up to Layer 3. It may include other sensors for vehicle diagnostics.
- Telephony Infrastructure (PSTN/VoIP lines): The physical voice lines and telephony infrastructure that support the call center operations in Layer 7.
- Cloud Infrastructure Servers: The underlying server clusters and storage solutions that host the core applications of the enterprise (D365, Taxi Management System, Database Servers). This infrastructure is the physical foundation for the entire ecosystem.
- Handheld device hardware: The physical hardware components of the driver’s handheld device, which connects to the data links in Layer 4.
3. Key Data Flow and Integration Scenarios
The power of this architecture is only unlocked by the seamless integrations and specific data flows, which are explicitly detailed in the accompanying diagram and the original requirements. We will now walk through several critical business scenarios to demonstrate the inter-layer cooperation.
3.1 Scenario 1: The Lifecycle of a Booking (Public Front to Driver App)
- Passenger Input: A passenger accesses the public facing website or mobile app (Layer 7) and enters booking details.
- Web API: The data flows securely through the Web API Gateway (Layer 4).
- Booking and Dispatch Logic: The request arrives at the Taxi Management System Logic (Layer 6).
- Auto Bidding Logic : The system applies configurable bidding logic (e.g., closest driver, driver rating).
- Location Context : The bidding logic requires the real-time location and status of all taxis, which is pulled from the Location Tracking analytics server (Layer 3).
- Fare Calculation : Simultaneous with bidding, the configurable distance-with-fare logic (Layer 6) calculates an estimated dynamic fare, which is accurate because of the high-frequency GPS updates (Layer 3).
- Dispatch Orchestration: The winning driver is identified. The orchestration logic in Layer 6 pushes the booking details through Mobile Data Protocol services (Layer 4).
- Driver Acceptance: The booking details arrive in the Driver-side mobile app (Layer 7) for “acceptance, rejection etc.” .
- Map Update: As the driver moves, GPS telemetry (Layer 1) feeds location tracking (Layer 3), which instantly updates the Control Room Map View (Layer 7) for real-time operations.
3.2 Scenario 2: The Contact Center and CRM Integration (CTI Flow)
This scenario is vital for the “Customer-Centric Support” requirements
- Incoming Call: A customer calls the Contact Centre. The call passes through the PSTN/VoIP lines (Layer 1) and is routed via the Genesys telephony platform.
- CTI Link: The call signalling (Layer 4) connects to the Genesys CTI integration middleware (Layer 5), which identifies the incoming phone number (ANI).
- Customer Lookup : The middleware uses the CRM capability logic (Layer 6) to query the Dynamics 365 Customer Service (Layer 5) database for the customer profile linked to that number.
- Screen Pop (Agent View): Simultaneously, the call is delivered to an agent’s phone (Layer 7), and a “screen pop” with the full customer profile from D365 appears on their Contact Centre interface. The agent now has a “Customer 360” view.
- Support and Action (Operational Data Provider): The agent addresses the customer’s request (e.g., check booking status, file feedback). Since D365 is the “Operational Data Provider” for all departments (Original text block), the agent has access to the same booking data that the operations and CSAT teams use, ensuring consistency.
- Manual/Auto Dispatch: If a new booking is required, the agent can initiate it, linking with the manual/auto dispatch logic in Layer 6 to push the booking to a driver.
- Closing the Loop (CSAT): Any feedback provided by the customer is captured in D365, directly feeding the CSAT Team Dashboard (Layer 7) for analysis and continuous improvement.
3.3 Scenario 3: From Operational Trip to Financial Closure (The Handheld Link)
This scenario demonstrates the critical integration of (Handheld) with (D365) and (Oracle E Business Suite (EBS) Finance), and the direct text requirements.
- Trip End: A trip is completed. The Driver-side mobile app (Layer 7) calculates the final fare based on the accurate distance telemetry (Layer 3).
- Physical Transaction: The driver uses the handheld device hardware (Layer 1) to initiate “receipt generation” and securely process the passenger’s “credit card payment” .
- Operational Data Sync: The trip details and payment status are synced from the handheld device (Layer 7) back to the enterprise, ensuring D365 (Layer 5) has accurate trip completion data (as the Operational Data Provider).
- Financial Data Flow (Original Text Block): Crucially, this is the trigger point for financial integration. Dynamics 365 is integrated with “financial transaction processing” (Original text block).
- Integration Middleware: The financial data flow passes through the Handheld data link (Layer 4) to the “financial data flow processing” component in Layer 5.
- Push to Oracle: The validated and orchestrated “financial transaction processing” data is “pushed to General Ledger of Oracle E Business Suite (EBS) Finance” (Original text block) in Layer 2.
- Financial Analysis : The Finance Team uses the integrated Oracle E Business Suite(EBS) Finance module (Layer 2) for “financial data analysis”. This analysis combines trip data with payment data to calculate driver commissions, asset depreciation, and fleet efficiency, providing comprehensive financial reporting.
4. Conclusion: A Blueprint for Success in the Modern Mobility Era
The architecture presented here is more than a list of integrated technologies; it is a strategic blueprint for a modern, data-driven taxi enterprise. By embracing a 7-layer, OSI-inspired structure, the organization can transcend the limitations of siloed systems and create a truly unified platform.
The core value of this ecosystem is not in the individual “best-of-breed” tools—Genesys for telephony, Microsoft Dynamics 365 for CRM, Oracle E Business Suite(EBS) for finance—but in their integration. D365’s role as the central operational data provider connects the front-end user experience (passenger, driver, agent) directly with core business logic (bidding, fare) and ultimately with enterprise-grade financial control (Oracle GL). The specialized Taxi Management System logic in Layer 6, fed by precise, real-time telemetry from Layer 3, ensures that the enterprise can make optimal, data-driven decisions at a high velocity.
The business benefits are clear:
- Enhanced Customer and Driver Satisfaction (CSAT): Through unified profiles, screen-pops, dynamic pricing, reliable dispatch, and integrated feedback loops.
- Improved Driver Productivity and Fleet Efficiency: Through precise location tracking, optimal dispatch orchestration, and accurate fare calculations.
- Robust Financial Control and Reporting: By eliminating manual data re-entry, automating the flow from operational trip to general ledger, and providing deep financial analysis.
- Operational Agility and Adaptability: Through the configurable logic and the modular, tiered architecture that isolates complexity and allows for future technology integration.
In the rapidly evolving mobility landscape, a taxi company cannot afford to stand still. This integrated architecture provides the foundation for sustainable success, transforming a collection of software applications into a powerful, agile, and customer-centric platform.