Microsoft Dynamics 365, Power Platform enthusiast having around 15 years of experience with complete SDLC. Along with that active Community Lead, MCT and Speaker.
Empowering frontier firms with the Case Management Agent (Advancing autonomous and semi-autonomous case lifecycle management in Dynamics 365 Customer Service).
Real-time User Journey
This journey illustrates the Fully Autonomous workflow for an email-based customer inquiry:
Inquiry Receipt: A customer sends an email regarding a malfunctioning device.
Autonomous Creation: The Case Management Agent (CMA) detects the intent, creates a new case, and automatically populates fields (Priority, Product Category, etc.) using AI-powered prediction.
Intelligent Triage: The CMA realizes it needs more details. It automatically sends a follow-up email to the customer with specific clarifying questions.
Resolution Logic: Once the customer replies, the CMA searches the knowledge base and triggers a custom agent (configured with the firm’s specific troubleshooting logic).
Proposal & Follow-up: The CMA drafts and sends a resolution email. It then waits for a predefined interval (SLA-based).
Autonomous Closure: After sending a satisfaction confirmation and receiving no further objections within the set timeframe, the CMA closes the case and triggers the Knowledge Management Agent to document the fix.
Step-by-Step: How to Enable This Feature
To enable and configure the Case Management Agent, follow these administrative steps:
Step 1: Admin Center Access
Sign in to the Customer Service admin center or Contact Center admin center.
Step 2: Navigate to Autonomous Agents
Go to Operations > Insights > Autonomous service agents (preview).
Step 3: Configure Case Creation Rules
Under the CMA settings, define the field mappings and business context (e.g., which channels like email or chat should trigger the agent).
Step 4: Set Resolution Parameters
Select the Knowledge Bases the agent should access and link any Custom Agents or Power Automate flows required for specialized resolution logic.
Step 5: Define Communication Templates
Choose the email templates for “Clarifying Questions” and “Proposed Resolution.” Set the Timing Intervals for follow-ups and the conditions for automatic closure.
Step 6: Toggle Autonomy Level
Decide if the agent should run in Semi-autonomous mode (drafting for human review) or Fully autonomous mode (direct interaction with customers).
Infographic: CMA Lifecycle Automation
Phase
Capability
Benefit
Creation
Auto-detection of intent across voice, chat, and email.
The primary focus is Microsoft’s leadership in the LCAP market for the seventh consecutive year, emphasizing the integration of Agentic AI, Generative Pages, and Professional Developer Tools within a fully governed environment.
Real-time User Journey: “Vibe-Coding” & Agentic Assistance
The journey described in the 2025 landscape moves from building static apps to orchestrating intelligent solutions:
Visionary Starting Point: A business user identifies a complex problem (e.g., global inventory rebalancing).
AI-Guided Design (Plans): The user uses Plans in Power Apps to describe the problem. AI generates a solution blueprint, including data models and logic.
Vibe-Coding (Generative Pages): The user uses natural language to “vibe-code” the interface. The AI creates modern, responsive pages instantly, removing the need for manual UI building.
Agent Integration: The maker adds an Agent into the app. This agent doesn’t just display data; it proactively explores it and assists the end-user with complex data entry.
Collaborative Use: An end-user opens the app and interacts with the Agent Feed, a central hub for human-agent collaboration, to resolve inventory discrepancies.
Step-by-Step: How to Enable Agentic Capabilities
To take advantage of the features highlighted in the Gartner report (like Plans and Agents):
Step 2: Start with “Plans”: Instead of starting from a blank screen, select the “Describe to build” or “Start with a Plan” option on the home screen.
Step 3: Enable Copilot: Ensure the Copilot component is enabled in your environment settings (managed via the Power Platform Admin Center).
Step 4: Create Generative Pages: Within the app designer, use the “New Page” menu and select “Generative Page” to build UI using natural language prompts.
Step 5: Add an Agent: Go to the Knowledge or Agents tab within the app studio to configure a built-in assistant that will help end-users navigate the app.
Step 6: Publish & Govern: Publish the app to your organization. Admins should use the Managed Platform settings in the Admin Center to monitor usage and secure data via Data Loss Prevention (DLP) policies.
Infographic: The 2025 Power Platform Pillars
The Gartner report recognition is built on these three strategic differentiators:
Pillar
Feature / Capability
Business Outcome
Agentic AI
Plans in Power Apps & Agent Feed
30% faster data entry and higher success for new builders.
Enterprise Scale
Single Admin Center & Azure Foundation
Confident global scaling with Managed Identities and VNet support.
Pro-Dev Integration
Native Visual Studio Code & Custom Connectors
Seamless “Fusion Team” collaboration between IT and business users.
A Comprehensive, Integrated Ecosystem: The Modern Taxi Industry Architecture Unveiled
The traditional taxi industry is at a critical juncture. Challenged by ridesharing disrupters, fluctuating demand, and complex regulatory requirements, taxi fleet operators must embrace digital transformation not merely as an upgrade, but as a survival imperative. The days of fragmented systems—where a radio dispatch tool operated in isolation from a customer database, and a finance system stood apart from daily operations—are over. To compete in the modern mobility landscape, a taxi company requires a holistic, integrated ecosystem that connects every touchpoint, from the passenger’s mobile app to the enterprise’s financial general ledger.
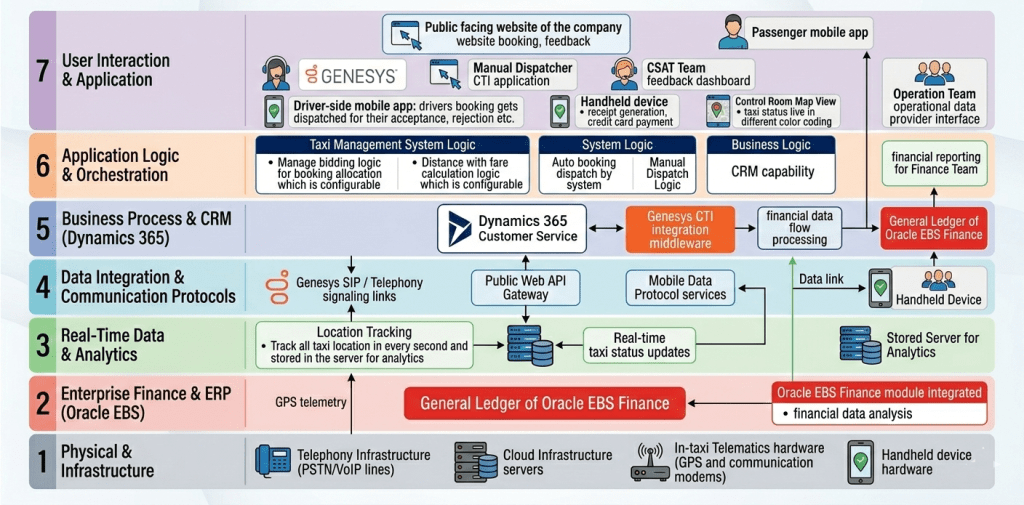
This article provides a comprehensive, deep-dive exploration of such an ecosystem, as presented in the accompanying 7-layer architecture diagram. This architecture, inspired by the OSI (Open Systems Interconnection) reference model, is designed for scalability, modularity, and, most importantly, seamless data integration. It showcases how a modern taxi enterprise can leverage a suite of best-in-breed technologies—including Genesys, Microsoft Dynamics 365, Oracle E Business Suite (EBS) Finance, and specialized taxi management software—to create a unified platform for enhanced efficiency, superior customer and driver experiences, and robust financial control.
The structure of this architecture is key. By segregating functions into distinct layers—from physical infrastructure to user interfaces—the enterprise can isolate complexity, integrate new components without disrupting existing ones, and gain a clear understanding of data flow. We will now proceed with a layer-by-layer analysis of this comprehensive ecosystem.
1. The OSI-Inspired Philosophy: Architecture for Scalability
The use of a layered, OSI-style structure for this architecture is not arbitrary; it is a strategic design choice. Just as the seven OSI layers abstract networking functions (physical, data link, network, transport, session, presentation, application) to allow different devices to communicate, this enterprise architecture abstracts functional systems to allow disparate software and hardware to operate as a single unit.
1.1 The Modularity of ‘Best-of-Breed’
This layered approach is crucial for a “best-of-breed” strategy. A taxi company doesn’t need to build a bespoke CRM, telephony, or ERP system; it needs to integrate the leading tools in each domain. This architecture makes that possible. For example, Dynamics 365 Customer Service provides a robust CRM capability in Layer 5, while Genesys provides leading telephony in Layer 7 and 5. Because these are in distinct, yet integrated, layers, the enterprise can replace or upgrade the CRM or the telephony solution without a complete system overhaul, as long as the integration interfaces in Layer 4 (Communication Protocols) remain consistent. This modularity reduces vendor lock-in and future-proofs the investment.
1.2 Clear Lines of Data Flow and Responsibility
The vertical structure also provides clarity on data ownership and responsibility.
Financial Data: Flows up from the physical transactions in Layer 1 (Handheld) and 3 (Trip Analytics) into D365 in Layer 5, and then directly into Oracle E Business Suite (EBS) in Layer 2 for final closure.
Operational Data: Telemetry (location, speed) moves from Layer 1/3 (In-taxi Telematics) up to Layer 6 (Taxi Management System Logic) and then into D365 (Layer 5) to serve as the operational data provider for the Operations and CSAT teams in Layer 7.
Customer Interaction: Originates in Layer 7 (Web/App/Phone), flows through Layer 4/5 (D365/CTI) to connect with business logic in Layer 6 (Bidding/Fare).
This clear flow allows different teams (Operations, Finance, CSAT, IT) to know exactly where to access their required data and which system is the “source of truth.”
2. A Detailed Deep-Dive into the Seven Layers
We will now traverse the stack, starting from the outermost interaction point.
2.1 Layer 7: The Frontline Interfaces (User Interaction & Application)
This is the most visible layer, where the enterprise meets its passengers, drivers, agents, and operational staff. It is the destination and source for crucial user input.
The Passenger Experience:
Public Facing Website: A critical entry point for booking, feedback, and customer engagement. As required the website provides a comprehensive “website booking, feedback” interface.
Passenger Mobile App: In a mobile-first world, this app is the passenger’s primary interaction tool, facilitating seamless booking, trip tracking, and communication.
The Driver Experience:
Driver-side Mobile App (Client Side): This app on the driver’s device is where bookings “gets dispatched for their acceptance, rejection etc.” It is also the point where GPS data and trip telemetry are gathered.
Handheld Device (Hardware Interface): Crucial for , this device, integrated with the mobile app, manages “receipt generation” and secure “credit card payment.” This is a critical physical-to-digital link for financial flow.
The Agent & Team Interfaces:
Contact Centre Department (Genesys): blend of manual and automated functions. This interface allows the “Contact Centre Team is using Dynamics 365 Customer Service along with Genesys for Inbound and outbound call supported by Auto booking dispatch by system along with remaining by manual dispatcher Team” (Original text block). It includes a “Manual Dispatcher CTI application” interface. This demonstrates the fusion of human skill and automated efficiency.
CSAT Team Feedback Dashboard: The dedicated interface for the CSAT team allows them to review and manage customer satisfaction data, acting as a feedback loop directly linked to D365 in Layer 5.
Control Room Map View: a control room with a “live in different color coding” taxi status. This map view interface is where the “Live taxi status updates” (from Layer 3) are presented visually to the Operations Team.
Operations Team Operational Data Provider Interface: A specific interface for the Operations team to consume the data generated by Dynamics 365, serving as their “Operational Data Provider”.
Finance Team Financial Reporting Interface: This interface allows the Finance team to consume the integrated data and analytics from Oracle E Business Suite (EBS)
2.2 Layer 6: Business Rules and Operational Orchestration (Application Logic & Orchestration)
This layer is the engine of the enterprise, containing the logic and business rules that define the taxi service itself. It processes the operational input from Layer 7, applies constraints, and directs action.
Taxi Management System Logic:
Manage Bidding Logic (Configurable): this component contains the critical rules for booking allocation. The bidding logic could be based on distance (closest driver), driver acceptance rating, first-responder, or a competitive bid process. Crucially, this logic is “configurable,” allowing the business to adapt rules in real-time based on market conditions, peak hours, or new business strategies.
Distance with Fare Calculation Logic (Configurable): this is where dynamic pricing and fare calculation rules reside. The calculations are based on distance (which is accurate to Layer 3), time, wait time, tolls, and dynamic multipliers. The “configurable” nature is key, allowing the enterprise to set different pricing models for different cities, seasons, or vehicle types.
System Orchestration Logic:
Auto booking dispatch by system & Manual Dispatch Logic: This orchestrates the flow of bookings to the dispatcher interfaces (Manual Dispatcher CTI app) in Layer 7, managing the blend of automated dispatch and manual override. It ensures that the right booking goes to the right driver or agent queue.
Business Logic (CRM Capability):
CRM Capability: this sub-component (of the central CRM system) defines the logic behind the “Customer 360” view. It handles data deduplication, profile matching, and interaction tracking, ensuring that when Genesys pulls a customer record, the agent has all necessary context.
2.3 Layer 5: Business Process and CRM (Dynamics 365)
This layer is the operational heart of the system, acting as the central hub for operational data, customer interaction, and inter-departmental workflows. It bridges the gap between customer-facing applications (Layer 7) and core business applications (Layer 6 and 2).
Dynamics 365 Customer Service: D365 provides the unified “CRM capability.” It serves as the “Operational Data Provider” (Original text block) for the Operation and CSAT Teams in Layer 7, delivering a consistent view of the business.
Genesys CTI integration middleware: This middleware is the vital link that integrates Genesys CTI with D365 (Requirement for original text block). It enables “screen pops” with customer information for incoming calls, allows for outbound dialling directly from the CRM, and syncs all call activity with the customer record, supporting the “Inbound and outbound call” functionality of the Contact Centre Team
Financial data flow processing: This component handles the orchestration of financial data flow from the physical handheld transactions to the General Ledger of Oracle E Business Suite (EBS). It acts as an integration point that may include data filtering, aggregation, and validation before pushing “financial transaction processing” (Original text block) to Oracle E Business Suite (EBS) in Layer 2.
2.4 Layer 4: Data Integration and Communication Protocols
This layer contains the pipes and channels that allow the vertical layers of the stack to communicate. Without these protocols, the data would remain siloed.
Web API Gateway: This secure gateway manages all web-based communication, linking the Public Facing Website in Layer 7 (booking/feedback) to the core booking logic in Layer 6 and D365 in Layer 5.
Mobile Data Protocol Services: A set of specialized protocols for the reliable transmission of mobile data from the Driver App and Handheld Device (Layer 7) back to the enterprise. This ensures that a crucial piece of data like a GPS update or a payment transaction is not lost, even in areas with poor cellular coverage.
Data link for Handheld Device: This dedicated link in Layer 4 connects the Handheld device from Layer 7 to the financial processing logic in Layer 5.
Genesys SIP / Telephony signalling links: this component manages the voice and signaling communication paths (SIP, VoIP) between the Contact Center agents (Layer 7) and the telephony platform (Layer 5), supporting inbound and outbound call functionality.
2.5 Layer 3: Real-Time Data and Analytics (Telemetry)
This layer deals with telemetry, state, and real-time intelligence. It ingests a high volume of raw data from the physical layer and processes it into useful information for the operational logic above.
Location Tracking: this component “Track all taxi location in every second and stored in the server for analytics.” This is a continuous feed of accurate GPS data (from Layer 1). The high-frequency (every second) updates are essential for real-time map visualization and precise fare calculations.
Real-time taxi status updates: Processed and validated location and status updates are fed from here up to the “Control Room Map View” in Layer 7, ensuring the map is live and accurate to the nearest second.
Stored Server for Analytics: This server acts as the primary data lake for storing all historical GPS and telemetry data, ready for offline “analytics.” The stored data can be used for things like driver performance analysis, route optimization, and identifying fraudulent activity.
2.6 Layer 2: Enterprise Finance and ERP (Oracle E Business Suite (EBS))
This layer is the financial closure and compliance hub of the enterprise. It is a secure environment for final data processing, general ledger maintenance, and financial analysis.
General Ledger of Oracle E Business Suite (EBS) Finance: requirements state that financial transactions are “pushed to General Ledger of Oracle E Business Suite (EBS) Finance” This is the final destination for all financial data flow, providing the central “financial reporting for Finance Team.”
Oracle E Business Suite(EBS) Finance module integrated: This integrated module provides the powerful “financial data analysis” capability allowing the Finance team to generate detailed reports and gain insights into the enterprise’s financial health, driver commission structures, and asset performance.
2.7 Layer 1: Physical and Infrastructure (Hardware)
This foundational layer is where the ecosystem meets the physical world. It includes all the hardware assets required for the system to function.
In-taxi Telematics hardware (GPS & communication modems): This hardware in the vehicle is the physical source of all telemetry data generating GPS telemetry that is fed up to Layer 3. It may include other sensors for vehicle diagnostics.
Telephony Infrastructure (PSTN/VoIP lines): The physical voice lines and telephony infrastructure that support the call center operations in Layer 7.
Cloud Infrastructure Servers: The underlying server clusters and storage solutions that host the core applications of the enterprise (D365, Taxi Management System, Database Servers). This infrastructure is the physical foundation for the entire ecosystem.
Handheld device hardware: The physical hardware components of the driver’s handheld device, which connects to the data links in Layer 4.
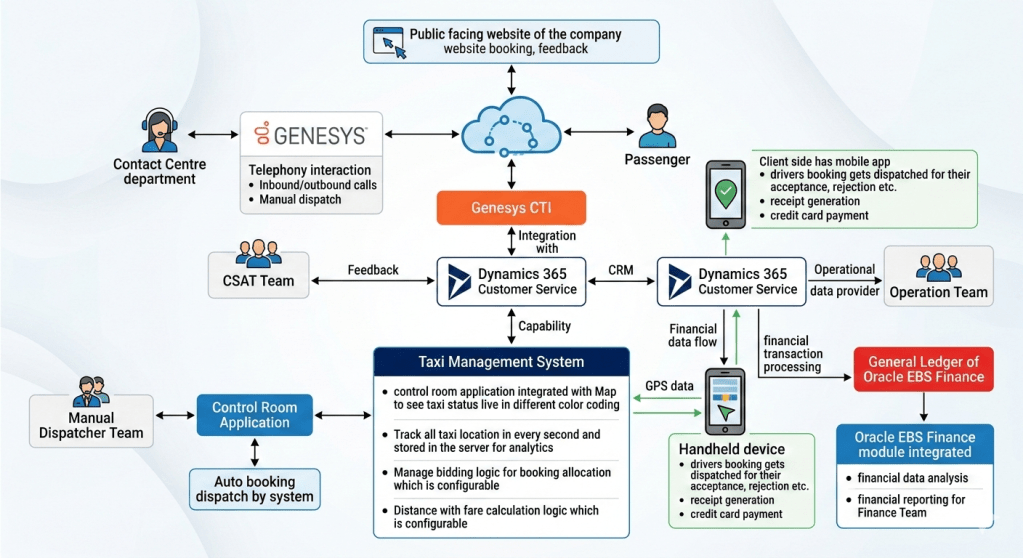
3. Key Data Flow and Integration Scenarios
The power of this architecture is only unlocked by the seamless integrations and specific data flows, which are explicitly detailed in the accompanying diagram and the original requirements. We will now walk through several critical business scenarios to demonstrate the inter-layer cooperation.
3.1 Scenario 1: The Lifecycle of a Booking (Public Front to Driver App)
Passenger Input: A passenger accesses the public facing website or mobile app (Layer 7) and enters booking details.
Web API: The data flows securely through the Web API Gateway (Layer 4).
Booking and Dispatch Logic: The request arrives at the Taxi Management System Logic (Layer 6).
Auto Bidding Logic : The system applies configurable bidding logic (e.g., closest driver, driver rating).
Location Context : The bidding logic requires the real-time location and status of all taxis, which is pulled from the Location Tracking analytics server (Layer 3).
Fare Calculation : Simultaneous with bidding, the configurable distance-with-fare logic (Layer 6) calculates an estimated dynamic fare, which is accurate because of the high-frequency GPS updates (Layer 3).
Dispatch Orchestration: The winning driver is identified. The orchestration logic in Layer 6 pushes the booking details through Mobile Data Protocol services (Layer 4).
Driver Acceptance: The booking details arrive in the Driver-side mobile app (Layer 7) for “acceptance, rejection etc.” .
Map Update: As the driver moves, GPS telemetry (Layer 1) feeds location tracking (Layer 3), which instantly updates the Control Room Map View (Layer 7) for real-time operations.
3.2 Scenario 2: The Contact Center and CRM Integration (CTI Flow)
This scenario is vital for the “Customer-Centric Support” requirements
Incoming Call: A customer calls the Contact Centre. The call passes through the PSTN/VoIP lines (Layer 1) and is routed via the Genesys telephony platform.
CTI Link: The call signalling (Layer 4) connects to the Genesys CTI integration middleware (Layer 5), which identifies the incoming phone number (ANI).
Customer Lookup : The middleware uses the CRM capability logic (Layer 6) to query the Dynamics 365 Customer Service (Layer 5) database for the customer profile linked to that number.
Screen Pop (Agent View): Simultaneously, the call is delivered to an agent’s phone (Layer 7), and a “screen pop” with the full customer profile from D365 appears on their Contact Centre interface. The agent now has a “Customer 360” view.
Support and Action (Operational Data Provider): The agent addresses the customer’s request (e.g., check booking status, file feedback). Since D365 is the “Operational Data Provider” for all departments (Original text block), the agent has access to the same booking data that the operations and CSAT teams use, ensuring consistency.
Manual/Auto Dispatch: If a new booking is required, the agent can initiate it, linking with the manual/auto dispatch logic in Layer 6 to push the booking to a driver.
Closing the Loop (CSAT): Any feedback provided by the customer is captured in D365, directly feeding the CSAT Team Dashboard (Layer 7) for analysis and continuous improvement.
3.3 Scenario 3: From Operational Trip to Financial Closure (The Handheld Link)
This scenario demonstrates the critical integration of (Handheld) with (D365) and (Oracle E Business Suite (EBS) Finance), and the direct text requirements.
Trip End: A trip is completed. The Driver-side mobile app (Layer 7) calculates the final fare based on the accurate distance telemetry (Layer 3).
Physical Transaction: The driver uses the handheld device hardware (Layer 1) to initiate “receipt generation” and securely process the passenger’s “credit card payment” .
Operational Data Sync: The trip details and payment status are synced from the handheld device (Layer 7) back to the enterprise, ensuring D365 (Layer 5) has accurate trip completion data (as the Operational Data Provider).
Financial Data Flow (Original Text Block): Crucially, this is the trigger point for financial integration. Dynamics 365 is integrated with “financial transaction processing” (Original text block).
Integration Middleware: The financial data flow passes through the Handheld data link (Layer 4) to the “financial data flow processing” component in Layer 5.
Push to Oracle: The validated and orchestrated “financial transaction processing” data is “pushed to General Ledger of Oracle E Business Suite (EBS) Finance” (Original text block) in Layer 2.
Financial Analysis : The Finance Team uses the integrated Oracle E Business Suite(EBS) Finance module (Layer 2) for “financial data analysis”. This analysis combines trip data with payment data to calculate driver commissions, asset depreciation, and fleet efficiency, providing comprehensive financial reporting.
4. Conclusion: A Blueprint for Success in the Modern Mobility Era
The architecture presented here is more than a list of integrated technologies; it is a strategic blueprint for a modern, data-driven taxi enterprise. By embracing a 7-layer, OSI-inspired structure, the organization can transcend the limitations of siloed systems and create a truly unified platform.
The core value of this ecosystem is not in the individual “best-of-breed” tools—Genesys for telephony, Microsoft Dynamics 365 for CRM, Oracle E Business Suite(EBS) for finance—but in their integration. D365’s role as the central operational data provider connects the front-end user experience (passenger, driver, agent) directly with core business logic (bidding, fare) and ultimately with enterprise-grade financial control (Oracle GL). The specialized Taxi Management System logic in Layer 6, fed by precise, real-time telemetry from Layer 3, ensures that the enterprise can make optimal, data-driven decisions at a high velocity.
The business benefits are clear:
Enhanced Customer and Driver Satisfaction (CSAT): Through unified profiles, screen-pops, dynamic pricing, reliable dispatch, and integrated feedback loops.
Improved Driver Productivity and Fleet Efficiency: Through precise location tracking, optimal dispatch orchestration, and accurate fare calculations.
Robust Financial Control and Reporting: By eliminating manual data re-entry, automating the flow from operational trip to general ledger, and providing deep financial analysis.
Operational Agility and Adaptability: Through the configurable logic and the modular, tiered architecture that isolates complexity and allows for future technology integration.
In the rapidly evolving mobility landscape, a taxi company cannot afford to stand still. This integrated architecture provides the foundation for sustainable success, transforming a collection of software applications into a powerful, agile, and customer-centric platform.
The primary focus of this update was the introduction of Agentic Actions and Dynamic Chaining, shifting the platform from simple conversation-based triggers to reasoning-based autonomous execution.
Real-time User Journey: Dynamic Chaining
The core “journey” updated in July 2025 involves how an agent handles a multi-step request without manual “if/then” branching:
Complex Prompt: A user asks, “Find the latest sales report for the Northeast region, summarize the top three concerns, and email that summary to the Regional Manager.”
Reasoning: Instead of looking for a specific pre-built “topic,” the agent uses its Generative AI orchestrator to identify the necessary steps.
Dynamic Action: The agent autonomously “chains” together three separate tools:
Tool 1 (SharePoint): Searches for and retrieves the specific PDF/Excel file.
Tool 2 (LLM Reasoning): Analyzes the content of that file to extract the top three concerns.
Tool 3 (Outlook): Drafts and sends the email to the specific contact.
Completion: The agent confirms the email has been sent and provides a copy of the summary to the user in the chat.
Step-by-Step: How to Enable Dynamic Chaining
To move your agent from “Classic” mode to the new “Agentic” reasoning mode:
Step 1: Open Agent Settings: In Microsoft Copilot Studio, select your agent and go to the Generative AI page in the side navigation.
Step 2: Switch Orchestration: Under the “Orchestration” section, select Dynamic Chaining (Preview). This allows the agent to use generative AI to choose the best topic or action to fulfill a request.
Step 3: Add Actions: Navigate to the Actions tab. Add the specific “skills” the agent can use (e.g., pre-built connectors for Outlook, SharePoint, or custom Power Automate flows).
Step 4: Refine Descriptions: For every action, provide a clear, natural language Description. This is critical, as the agent uses these descriptions to “know” when to trigger that specific tool.
Step 5: Test & Publish: Use the Test Pane to verify the agent can correctly chain these tools together before publishing to your users.
Infographic: The Shift to Agentic AI
The July 2025 update defined a clear evolution of the platform’s architecture:
Diagnostics and telemetry for Dynamics 365 Contact Center voice channel (Enhanced technical monitoring and troubleshooting tools for IT administrators and supervisors).
Real-time User Journey
This journey illustrates how an IT Administrator uses telemetry to resolve a “poor call quality” issue reported by a remote team:
Alert Notification: The IT Admin receives an automated alert in the Power Platform Admin Center indicating that call quality has dropped below a specific threshold for the “West Coast” region.
Dashboard Investigation: The Admin opens the Voice Diagnostics Dashboard. They see real-time telemetry showing high Packet Loss and Jitter for several active calls.
Granular Drill-down: The Admin clicks on a specific problematic call. They can see the technical path: the agent is using a wireless connection with low signal strength and an uncertified headset.
Proactive Resolution: While the call is still ongoing, the Admin identifies that the issue is local to the agent’s network. They send a quick instruction to the supervisor to have the agent switch to a wired connection.
Post-Call Analysis: After the call ends, the Admin reviews the Historical Telemetry to see if this is a recurring pattern for that specific agent or a broader ISP issue in the region.
SLA Validation: The Admin exports the telemetry data to prove to stakeholders that the voice platform remained stable, but local network conditions were the cause of the disruption.
Step-by-Step: How to Enable This Feature
To enable comprehensive diagnostics and telemetry, administrators must configure the Azure and Power Platform integration:
Step 1: Admin Center Access
Sign in to the Contact Center admin center.
Step 2: Connect to Azure Application Insights
Navigate to Operations > Insights > Telemetry. Choose the option to “Connect to Azure Application Insights.” This allows the raw voice telemetry to flow into your own Azure instance for long-term storage and analysis.
Step 3: Enable Voice Diagnostics
In the Voice Settings section, toggle the “Enable real-time voice diagnostics” switch to On. This enables the live monitoring of packet loss, latency, and jitter.
Step 4: Configure Alert Rules
In Azure Monitor, set up “Alert Rules” based on the telemetry data. For example, set an alert to trigger if latency exceeds 200ms for more than 5% of calls in a 10-minute window.
Step 5: Grant Permissions
Ensure IT Administrators have the “Environment Admin” or “Service Reader” role in both Power Platform and the associated Azure subscription to view the dashboards.
Step 6: Update Agent Profiles
Ensure agents are using the Desktop Companion Application (DCA), as it provides the most accurate local hardware and network telemetry back to the diagnostics engine.
Infographic: Voice Telemetry Metrics
Metric
Definition
Impact on Call Quality
Latency
The time it takes for voice data to travel from point A to B.
High latency causes “talk-over” and awkward silences.
Jitter
Variation in the delay of received packets.
High jitter results in garbled or “robotic” sounding audio.
Packet Loss
Voice data packets that fail to reach their destination.
Causes “drop-outs” where words or parts of sentences are missing.
MOS Score
Mean Opinion Score (1-5 scale) of audio quality.
A 4.0+ is considered “toll-quality” (clear and consistent).
Endpoint Data
Headset type, CPU usage, and Browser version.
Identifies if the issue is hardware or software-related.